How Can In-Line Color Measurement Optimize Feeders in Plastics Processes?
A plastics compounding process typically uses up to eight feeders to accurately dose the polymer, fillers (e.g., calcium carbonate), color (e.g., carbon black, titanium dioxide, or color masterbatches), additives, and possibly regrind or post-consumer recycled content. Loss-in-weight feeders can dose even small quantities with high accuracy. In addition, feeders can be designed to accurately feed even difficult materials that do not flow easily. Automated systems with a sensor on each feeder signal the system to automatically refill the feeders with more material when needed. A programmable logic controller (PLC) orchestrates all these feeders to create the specified formulation.
Even with all these modern, automated systems, feeding problems can occur. For example, instability or partial blockage in a feeder may be too minor to sound an alarm but can still result in incorrect dosage. If one feeder has a problem, the whole formula is affected. As a result, the end product may be outside of the specifications. How can these issues be identified and corrected before they create waste? An in-line UV/Vis spectrophotometer is a tool that can measure color in real-time to give operators a better understanding of what is happening in the feeders as well as the extruder so that they can make corrections quickly.
Using an in-line spectrophotometer as a process analyzer and diagnosis tool
In-line UV/Vis spectrophotometers measure color in real-time in the polymer melt and generate a color-specific spectrum. The software can convert this spectrum to a point in color space and display the results as color coordinates (L*, a*, b*). A correct, in-spec color indicates the wellness of the process and product. An out-of-spec color can show multiple problems in the feeders. For example, partial blockages such as an “arch” or a “rathole” can form, and the jammed material can release suddenly, creating a heavy discharge. This change would cause a disturbance in the measured color. If the blockage were in a color feeder, it would show a change in L*, a*, and b*, but even a clear additive or a white filler would show a change in L*, which indicates lightness.
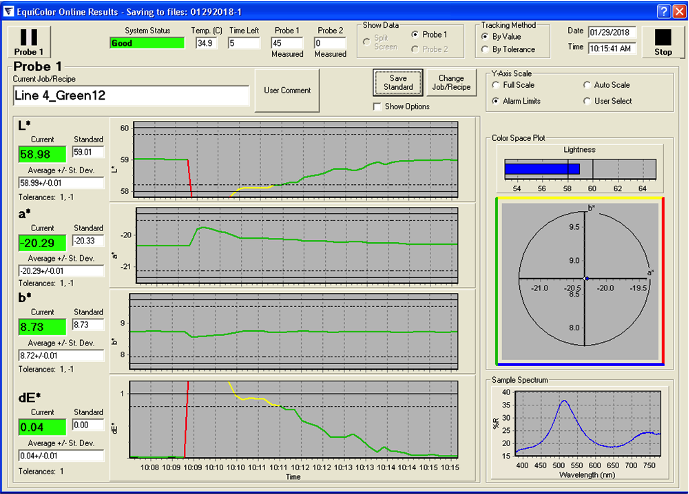
For example, Figure 1 shows a display from Equitech’s EquiColor software, in which the L* value in the top graph has suddenly dropped below the specification limit, as shown by the red line. The dE* value, calculated from L*, a*, and b*, also shows that the product is out-of-spec. The operator quickly adjusted the L*, and dE* moved back in-spec, as shown by the green line.
Identify feeder problems and control color drift
An in-line spectrophotometer can be used to identify and troubleshoot problems with feeders. As real-time data is continuously collected and displayed, the operator can see if any points are out of specification and can observe if these are sporadic or sustained over time. In addition, the data can reveal a trend—such as color drift; a sudden change—such as a change in raw material type or amount; or a pattern, which may indicate the feeder is not dosing as it should. Color is a vital indicator of the process and is sensitive to changes.
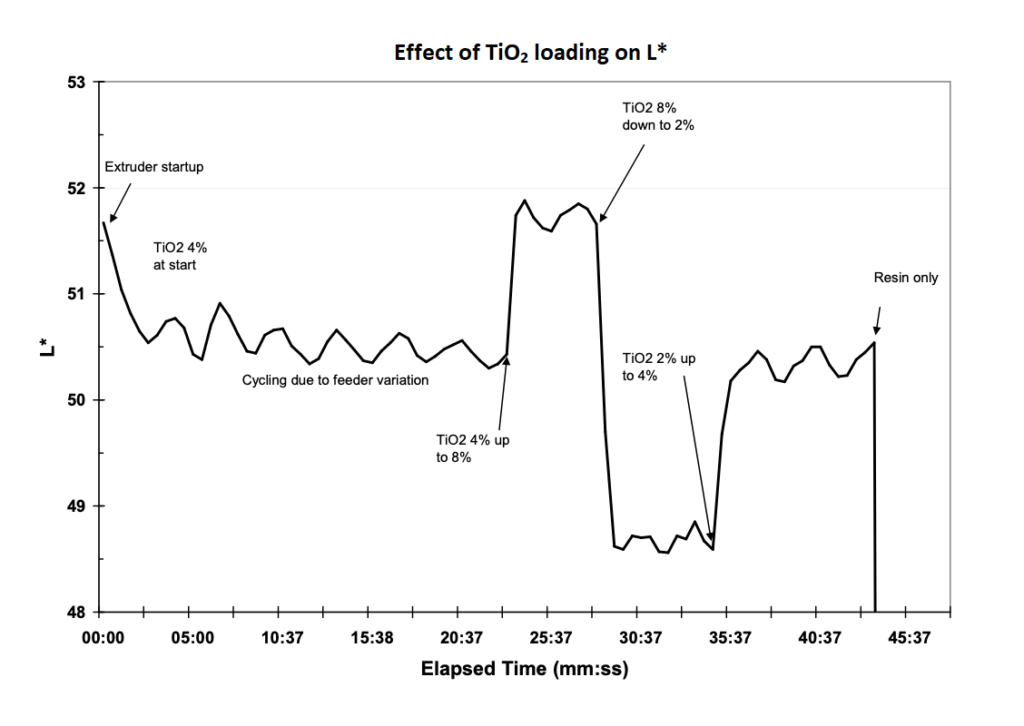
Figure 2 demonstrates how L* varies with a change in titanium dioxide (TiO2) amount in an ABS compound. At start-up (time 0), the feeder was set to dose 4% TiO2. The first 2 minutes are the start-up phase. After start-up, the L* value should be consistent when the process reaches a steady state. In Figure 2, however, the L* value shows a sinusoidal variation from 2 minutes to about 22 minutes. This variation indicates that the feeder is pulsating. A potential cause of this is that the TiO2 could have too high of a moisture content that causes it not to feed uniformly.
At approximately 22 minutes, the TiO2 content was raised to 8%, and the L* sharply increased. At approximately 28 minutes, the TiO2 content dropped to 2%, and the L* value also dropped. Finally, at 35 minutes, the TiO2 content was raised to 4%, and the L* value increased. This chart demonstrates that in-line color measurement can be used to track TiO2 content in real-time and identify feeder variation.
In-line color measurement
Equitech’s In-line Process Spectrophotometer (IPS) measures color in-line in real-time, directly in the polymer melt, using Reflection Polymer Melt Probes invented by Equitech. The real-time data from the IPS can be used to identify and correct problems with feeders quickly. In-line measurement can also be used in closed-loop control for a more efficient process that reduces scrap and produces a higher-quality product. Contact Equitech’s experts to learn more about how an in-line process spectrophotometer can benefit your operation.